Identify penguin species using multinomial Logistic Regression
analysis
R
Author
Aditya Ranade
Published
April 29, 2025
I found this dataset on UCI machine learning repository which gives the dataset for 3 penguin species in the islands of Palmer Archipelago, Antarctica. It has some basic measurements on the penguins of the 3 species.
library(reshape2)library(ggplot2)library(dplyr)library(ggh4x)library(GGally)library(naivebayes)library(caret)library(nnet)# Data is available in the palmer penguins package in Rlibrary(palmerpenguins)# Data processingdata0 <- penguinshead(data0)
# A tibble: 6 × 8
  species island    bill_length_mm bill_depth_mm flipper_length_mm body_mass_g
  <fct>   <fct>              <dbl>         <dbl>             <int>       <int>
1 Adelie  Torgersen           39.1          18.7               181        3750
2 Adelie  Torgersen           39.5          17.4               186        3800
3 Adelie  Torgersen           40.3          18                 195        3250
4 Adelie  Torgersen           NA            NA                  NA          NA
5 Adelie  Torgersen           36.7          19.3               193        3450
6 Adelie  Torgersen           39.3          20.6               190        3650
# ℹ 2 more variables: sex <fct>, year <int>
data0 |>str()
tibble [344 × 8] (S3: tbl_df/tbl/data.frame)
 $ species          : Factor w/ 3 levels "Adelie","Chinstrap",..: 1 1 1 1 1 1 1 1 1 1 ...
 $ island           : Factor w/ 3 levels "Biscoe","Dream",..: 3 3 3 3 3 3 3 3 3 3 ...
 $ bill_length_mm   : num [1:344] 39.1 39.5 40.3 NA 36.7 39.3 38.9 39.2 34.1 42 ...
 $ bill_depth_mm    : num [1:344] 18.7 17.4 18 NA 19.3 20.6 17.8 19.6 18.1 20.2 ...
 $ flipper_length_mm: int [1:344] 181 186 195 NA 193 190 181 195 193 190 ...
 $ body_mass_g      : int [1:344] 3750 3800 3250 NA 3450 3650 3625 4675 3475 4250 ...
 $ sex              : Factor w/ 2 levels "female","male": 2 1 1 NA 1 2 1 2 NA NA ...
 $ year             : int [1:344] 2007 2007 2007 2007 2007 2007 2007 2007 2007 2007 ...
# Check the rows which do not have any entriessum(is.na(data0)) # 19 NA values
[1] 19
# exclude the rows which has NA in themdata00 <-na.omit(data0)
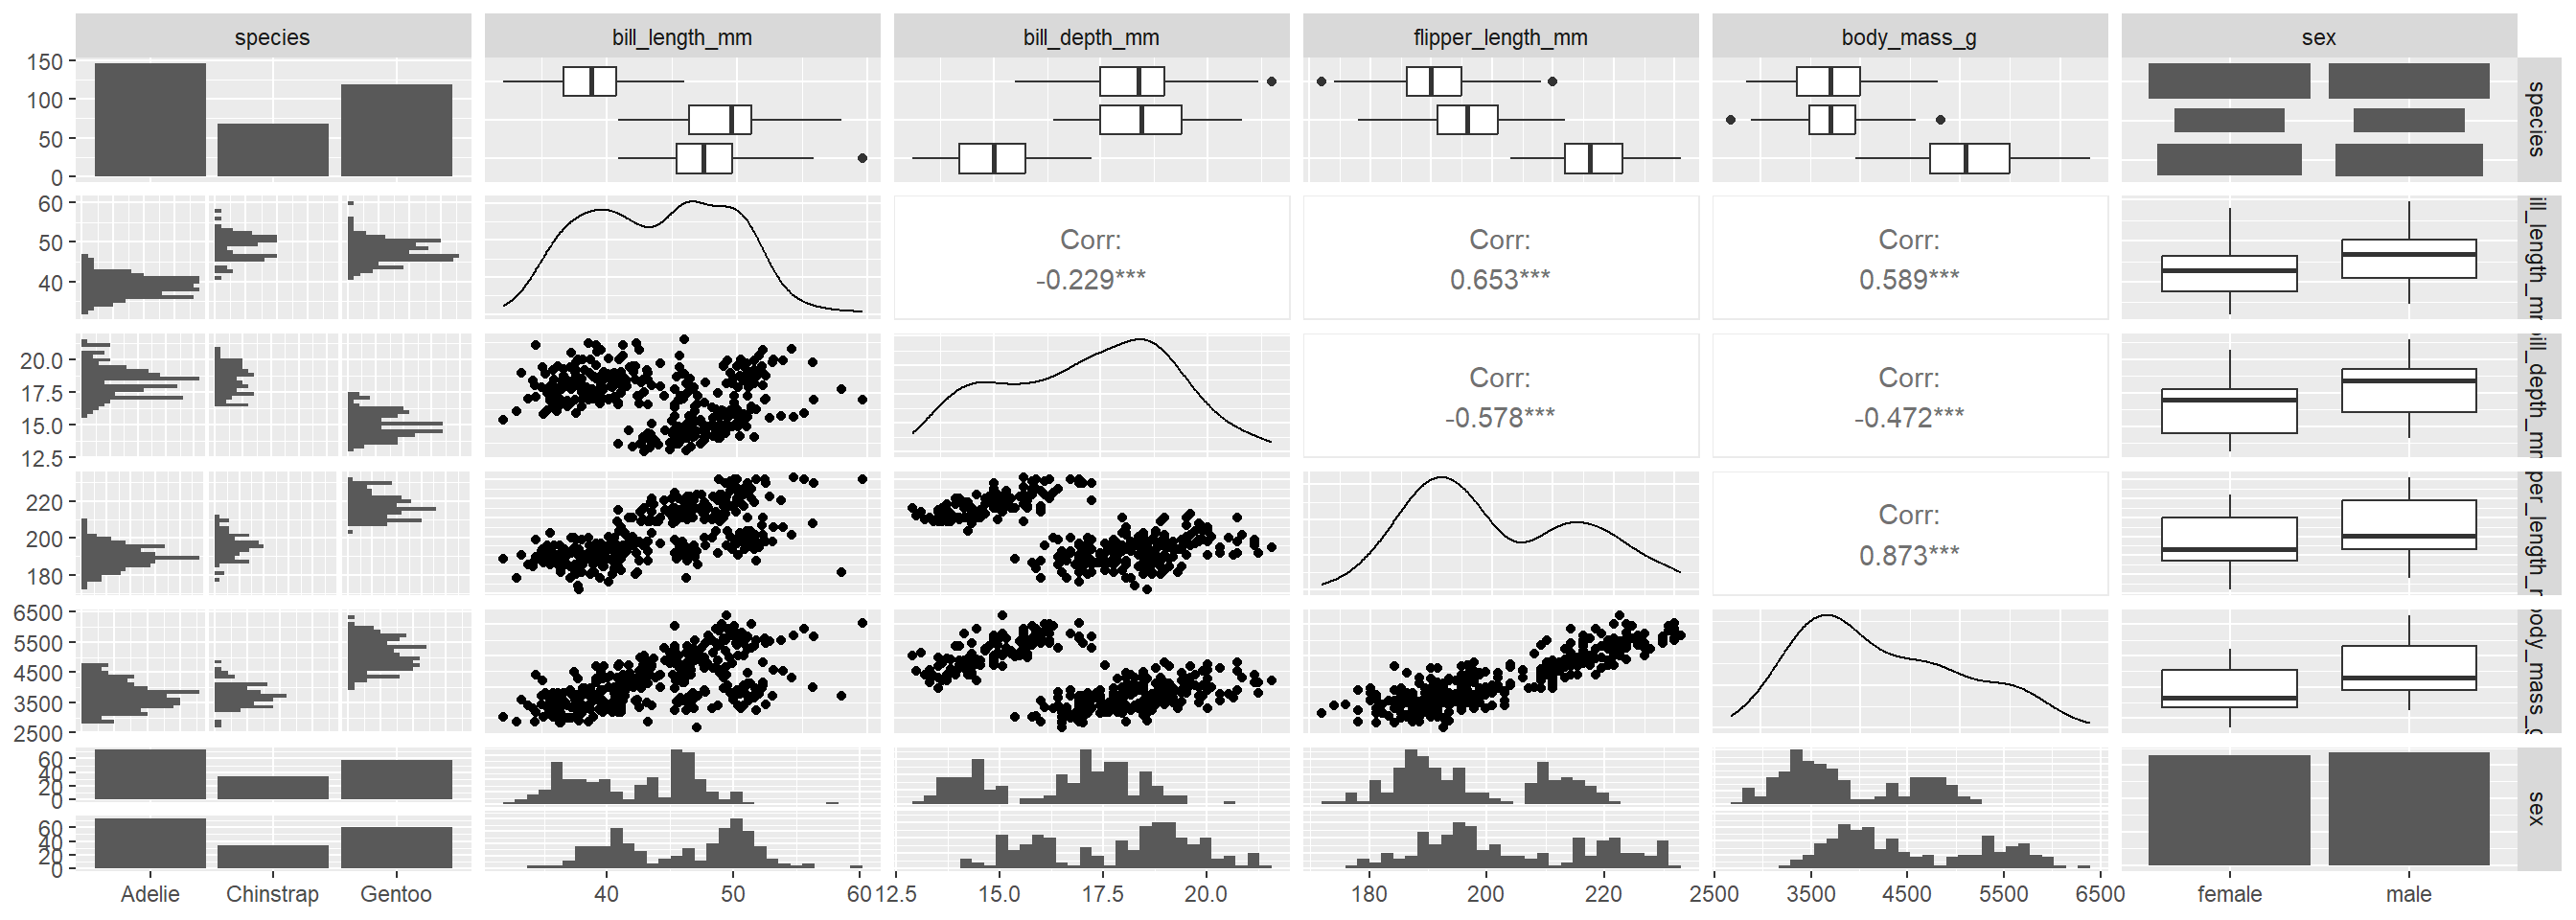
# Pairs plot between the explanatory variables to # check correlation between each pair of the variablesggpairs(data00[,-c(2,8)])
It is not unexpected to see multicollinearity in the data for the continuous variables since they are body measurements for the penguins.
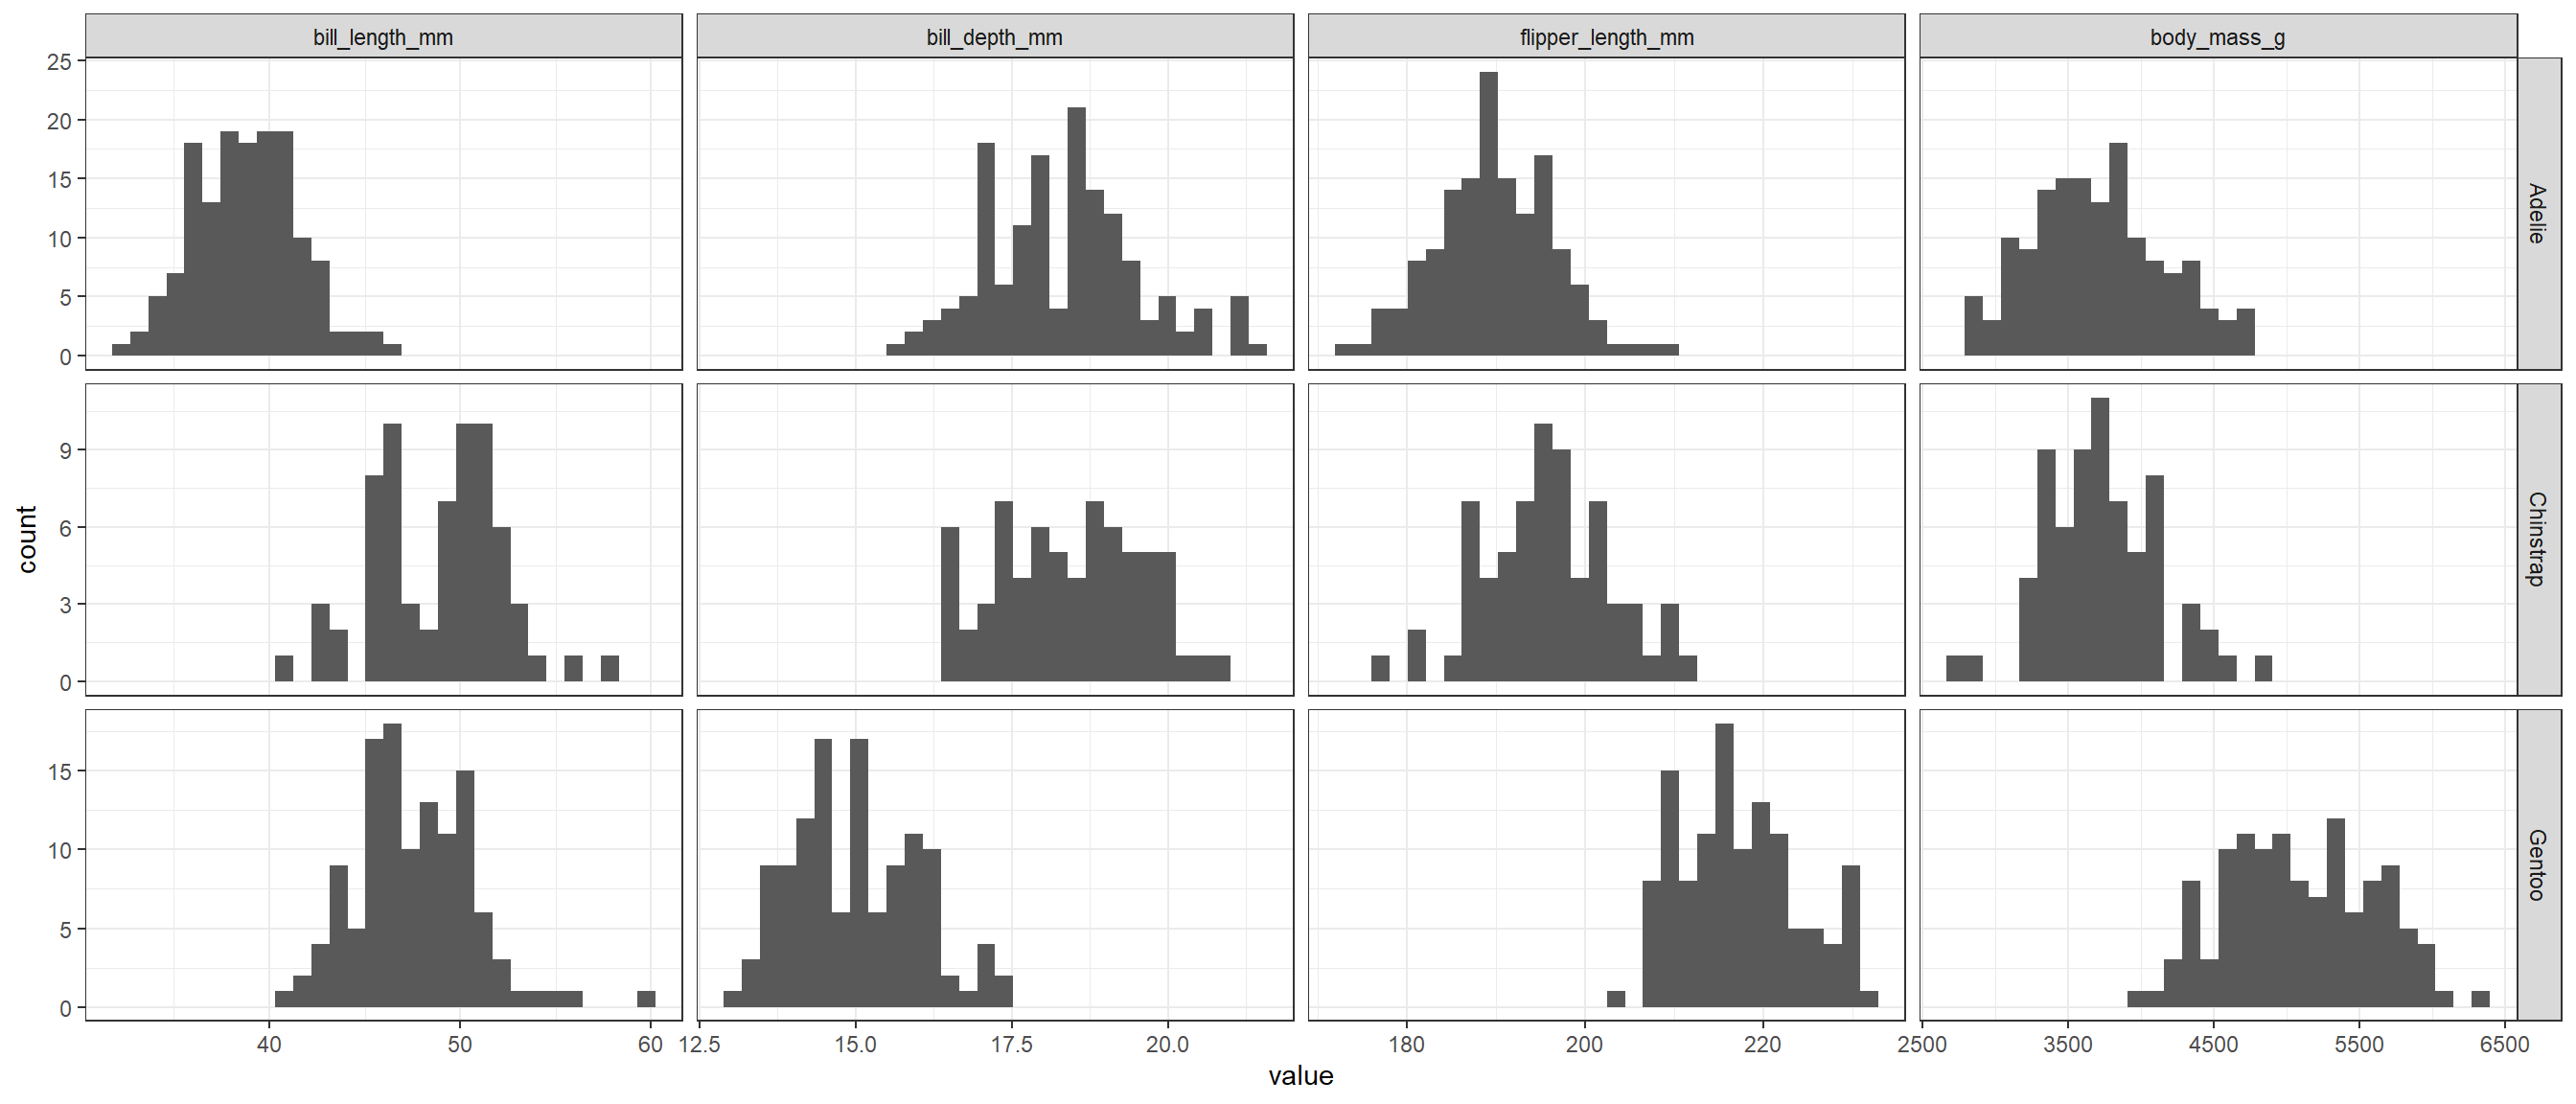
# Histogram based on speciesmelted_data <-melt(data00[,c(1,3,4,5,6)], id="species")# Plot the histogram of all the variablesggplot(melted_data,aes(value))+geom_histogram(aes(),bins =30)+facet_grid2(species~variable, scales="free")+theme_bw()
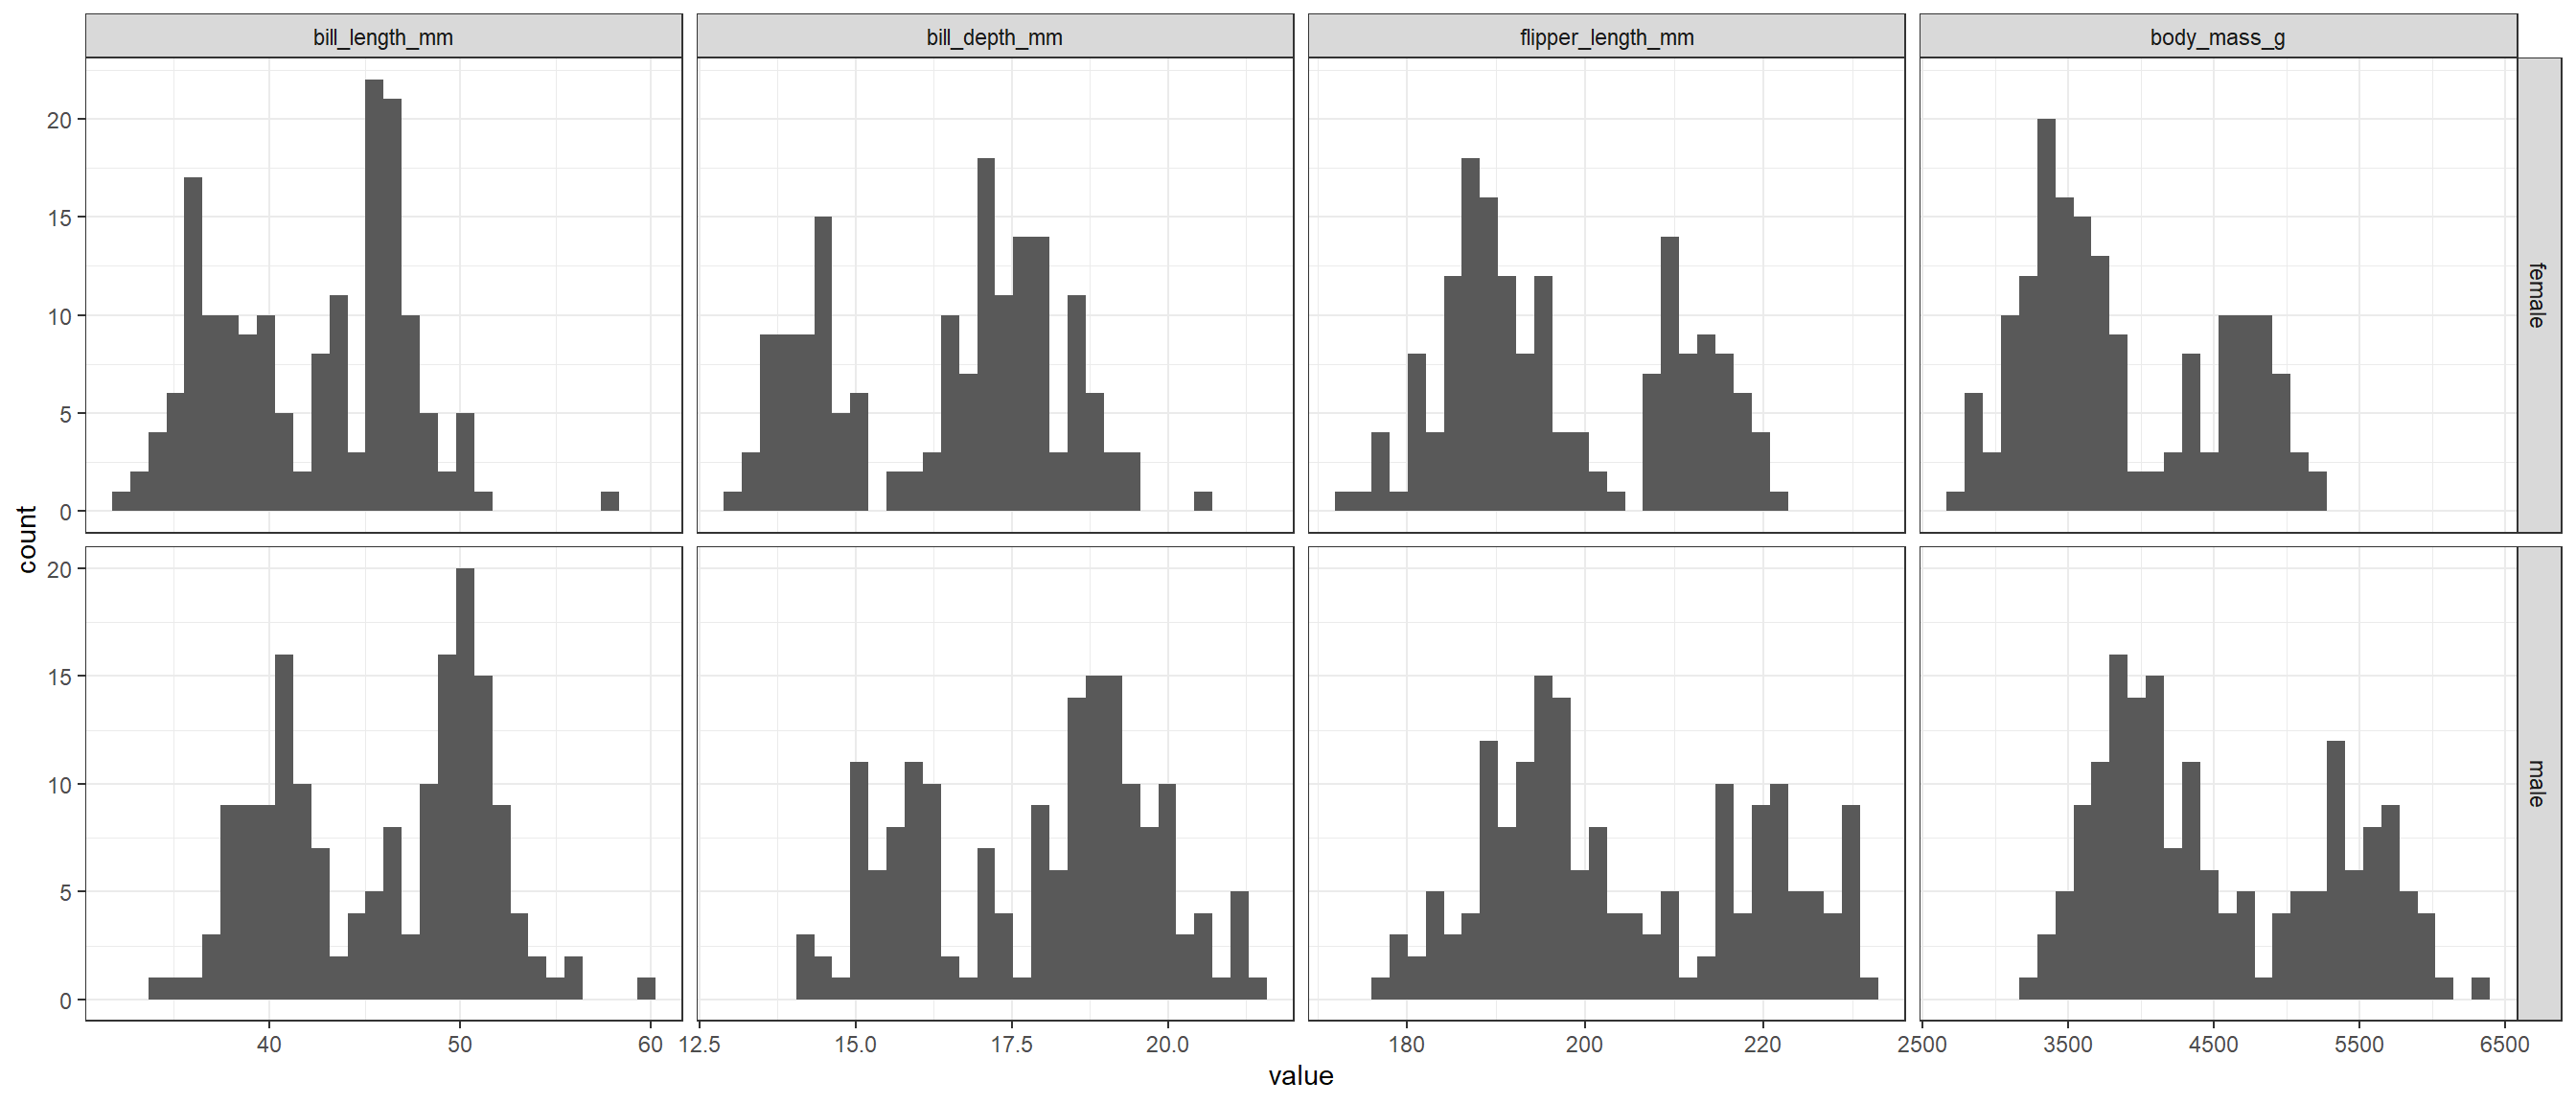
# Histogram based on sexmelted_data2 <-melt(data00[,c(3,4,5,6,7)], id="sex")# Plot the histogram of all the variablesggplot(melted_data2,aes(value))+geom_histogram(aes(),bins =30)+facet_grid2(sex~variable, scales="free")+theme_bw()
There is a distinct difference in the histogram of all the variables based on the species and sex. We will look to build a naive Bayes classification model to identify the species of penguins. First let us split the data into training and testing set.
# Select variables to be used in the modeldata <- data00 %>% dplyr::select(species,bill_length_mm,bill_depth_mm, flipper_length_mm,body_mass_g)data1 <-subset(data, species =="Adelie")data2 <-subset(data, species =="Chinstrap")data3 <-subset(data, species =="Gentoo")# split the data into training (70%) and testing (30%) dataseed <-33set.seed(seed)ind1 <-sample(floor(0.7*nrow(data1)),replace =FALSE)ind2 <-sample(floor(0.7*nrow(data2)),replace =FALSE)ind3 <-sample(floor(0.7*nrow(data3)),replace =FALSE)# Training datasetdata_train <-rbind(data1[ind1,],data2[ind2,],data3[ind3,])data_train |>count(species)
# A tibble: 3 × 2
  species       n
  <fct>     <int>
1 Adelie      102
2 Chinstrap    47
3 Gentoo       83
# A tibble: 3 × 2
  species       n
  <fct>     <int>
1 Adelie       44
2 Chinstrap    21
3 Gentoo       36
We now build a multinomial logistic regression model to identify the species of Penguins. A multinomial logistic regression model is used when we have more than 2 nominal classes in a categorical variables.
model2 <-multinom(species ~ ., data = data_train)
# weights:  18 (10 variable)
initial  value 254.878051
iter  10 value 18.171584
iter  20 value 3.530079
iter  30 value 1.576129
iter  40 value 0.007276
iter  50 value 0.000719
iter  60 value 0.000656
iter  70 value 0.000216
iter  80 value 0.000214
iter  90 value 0.000195
iter 100 value 0.000192
final  value 0.000192
stopped after 100 iterations